Social polling is a great way to connect your learners and encourage deeper reflection.
There are two ways you can use the Polls feature – either by creating a Graphed Results page or inserting Graphs directly into your text boxes.
To use the social polls feature to show the results of a question you'll need to have:
- added a Survey page to your Project (see Building a question page for instructions on how to add a question page to your Project) and
- set your Survey page to report a score (see Recording scores for graded questions if you’re not sure how to set a page to be scored)
You may also want to make sure your Survey question isn't taking up a share of the total score. Because Survey questions don't have correct or incorrect answer, they cannot contribute towards the share of the score they account for. This isn't too important if you are not using the learner's score as a measure of success but this may affect the learner's results if there are other questions in the course that are assessing their knowledge. For more information, see Preventing a scored page from contributing to the score total.
|
Note: This feature is for use with the Online Link or SCORM for LMS Release modes. It is not available to use with the Backup SCORM Release. For more information about the difference between release modes, see Deciding which Release mode is right for your Project. |
Graphed Results
This page will show the results of a Survey question page in your Project, this is an excellent way to illustrate to your learners how their peers have interacted with the course.
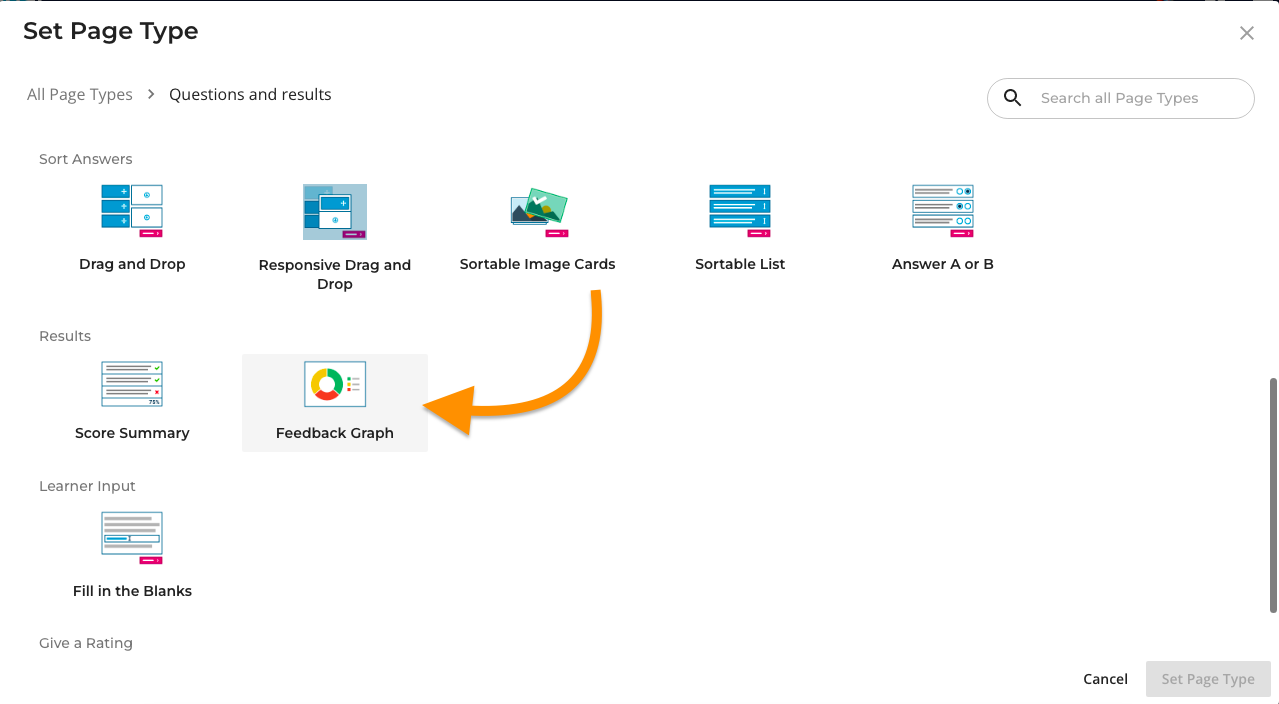
1. Add your graph page by adding a new page and selecting Feedback Graph from the Set Page Type pop-up:

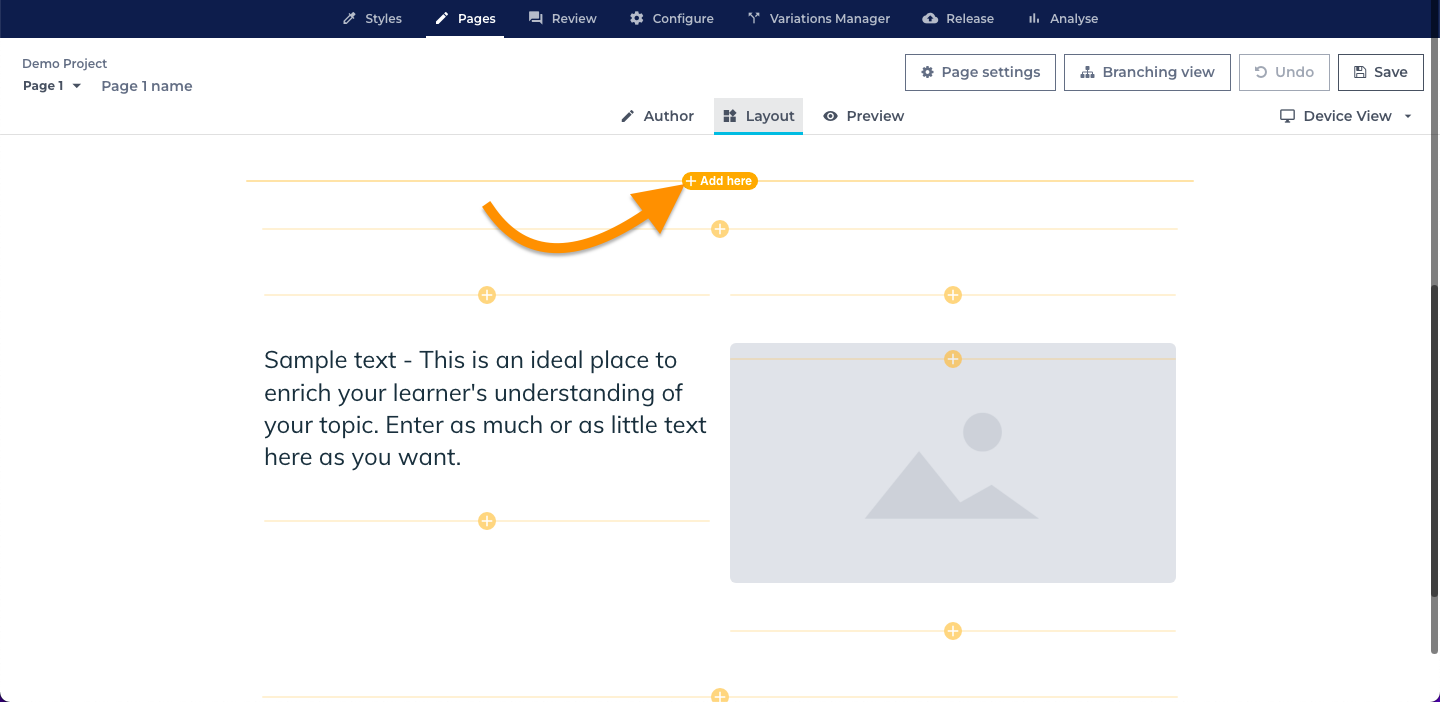
2. Or press the orange Add here button to add a graph directly to your page in Layout:

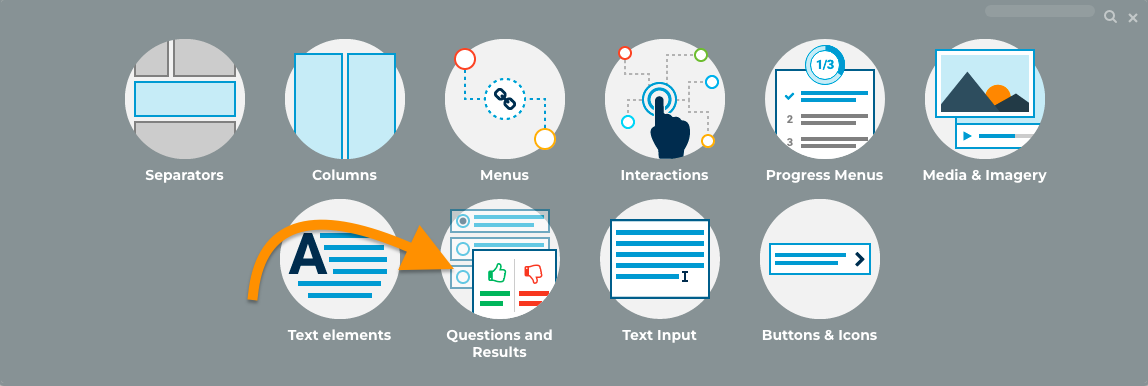
3. Select Questions & Results:

4. Select Results:

5. Select Graphed question feedback:

6. Select the Edit button for the chart to choose which page the graph pulls its results from and the graph type. Select the options from the Page and Graph Type drop down menus.

The Graph's colours will be determined by the colour set in the Graphs tab in your Style. For more information about how you can change this, see Editing a Style.
Using Graphs to show a result
1. Open the page which you would like the graph to be displayed on (this needs to be a different page to the scored page which you are reporting from).
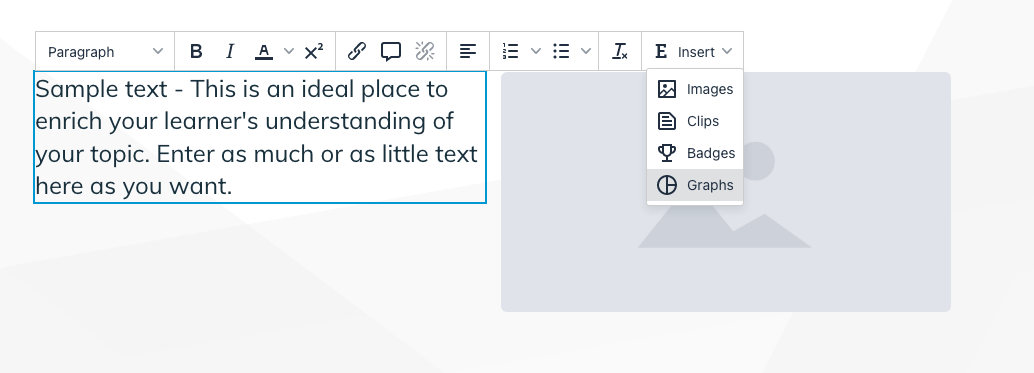
2. Select a text field. The text formatting toolbar will appear. From the toolbar, select Graphs in the Insert dropdown:

See Feature Focus: Working with the text formatting toolbar for more information about the options available in the toolbar.
3. In the Graphs menu, select the page you would like to display results from using Page to graph results from dropdown, then choose the type report type you would like to display from the Graph type dropdown:
Now when you release your course your graph will appear and your Learners will be able to see information on how their peers answered.
| Tip: Your graph will only display results in your final release. If your graph has not yet collected enough data to show results, the graph will show the message: There is not yet enough data to display this graph. In Preview, the graph will always display example data. |
|
Note: The Graphs feature can only be used for single-answer questions – i.e. it isn't possible to use it with multiple response questions. |